Lifecycle Cost vs Capex: The Biggest Mistake in Marine Investments
EFFICIENCY BEFORE FUEL · SERIES POST 8 · WEEK 15 , PART I · APRIL 2026
Why Upfront Capital Expenditure Thinking Destroys Long-Term Value in Shipping
Maritime Industry | Lifecycle Cost Analysis | Strategic Intelligence Brief | René Grywnow, DBA
Investment committees that judge marine projects by Capex alone are not being prudent, they are being systematically wrong. The most expensive decision in shipping is rarely the project you approve; it is the project you reject because the upfront number looked large. A 10-year total cost of ownership analysis changes nearly every conclusion.
EXECUTIVE SUMMARY
Capex is only 30–40% of the relevant financial information in any marine investment decision, yet it remains the dominant filter in most approval processes, destroying value systematically.
Full 10-year TCO analysis at an 8% discount rate shows that combined drydock efficiency retrofits (hull + propeller + IE4/IE5 pumps + VFD) consistently deliver NPV of USD 8–15 m against Capex of USD 2.5–5 m, a ratio no dual-fuel newbuild can match (ABS, 2026; Wärtsilä, 2026).
Poseidon Principles and Sea Cargo Charter have made TCO the operative credit language: projects with payback beyond five years and high external dependency face declining access or premium financing rates; efficiency retrofits now qualify for green finance at 40–60 basis points below standard terms (PwC, 2026).
1. The Capex Trap: Why Decision-Makers Systematically Compare the Wrong Number
Every investment committee in shipping asks the same first question: "How much does this cost?" It is a reasonable instinct, capital is finite, and approval gates exist for good reasons. The problem is that this question, answered with a Capex figure, produces a number that contains less than half the information required to make a sound decision.
Consider the comparison that plays out repeatedly across boardrooms: a dual-fuel newbuild at USD 40–50 million is presented as a strategic move toward decarbonisation. It looks bold. It signals commitment. It is also an 8–12 year payback vehicle with structural dependency on fuel infrastructure that does not yet exist at sufficient scale, in sufficient ports, at predictable price spreads. Meanwhile, the same committee reviews a USD 500,000 pump upgrade with a 14-month payback and dismisses it as maintenance spend, below the threshold of strategic attention.
This is the Capex trap in its most consequential form. The pump upgrade is not a maintenance item: at a 10% WACC over ten years, it generates more risk-adjusted net present value per dollar invested than most newbuild programmes. The problem is not the project; it is the metric.
Nature Sustainability (2025) and PwC (2026) independently confirm the structural pattern: across vessel classes and trade routes, efficiency measures, those that act physically and mechanically on fuel consumption, systematically outperform fuel-switching investments across the full lifecycle. The reason is straightforward. Efficiency measures are price-independent. They do not require LNG bunkering infrastructure, methanol supply chains, or ammonia terminal agreements. They deliver savings the day the vessel resumes commercial operation, regardless of what bunker markets do.
👉 Key Insight: Capex is only 30–40% of the relevant information. Total cost of ownership is the only metric that captures both financial return and strategic risk simultaneously. Investment committees that filter on Capex alone will consistently approve the wrong projects, and reject the right ones.
2. TCO in Practice: Four Investment Options, One Framework
To make the comparison concrete, the following table applies a standardised 10-year TCO framework at an 8% discount rate across four representative investment options. All figures are based on a mid-size bulk carrier or tanker in the 30,000–60,000 DWT range, consistent with ABS Retrofit Reports (2026) and Wärtsilä Lifecycle Optimisation data (2026).
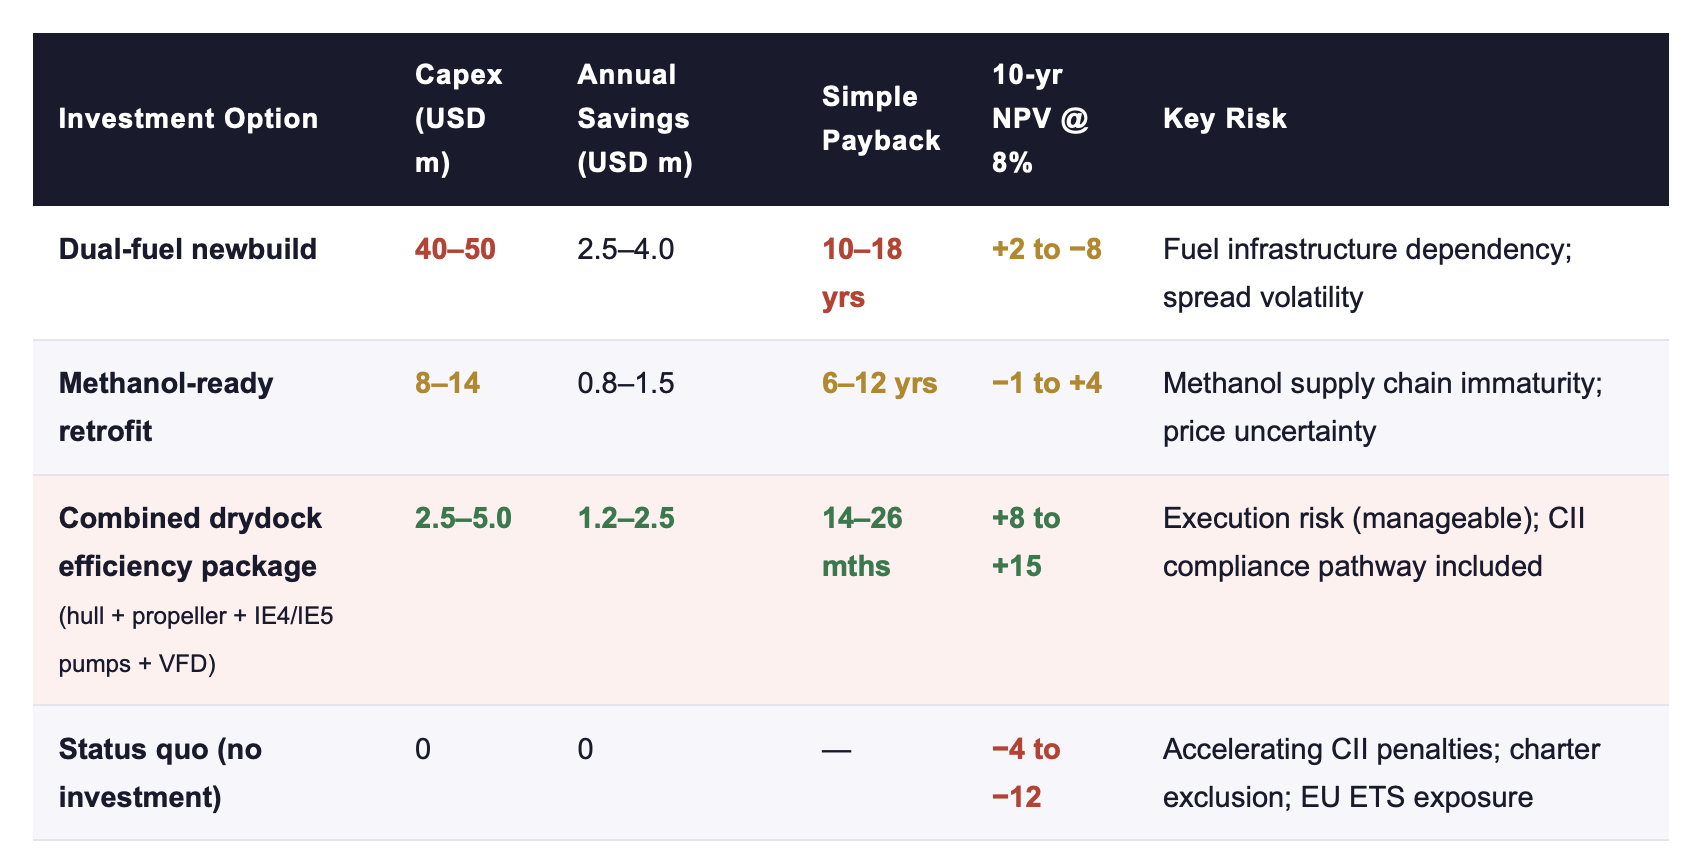
Sources: ABS Retrofit Reports, 2026; Wärtsilä Lifecycle Optimisation, 2026; PwC, 2026. NPV range reflects scenario spread (base/adverse bunker price; 8% discount rate; 10-year horizon).
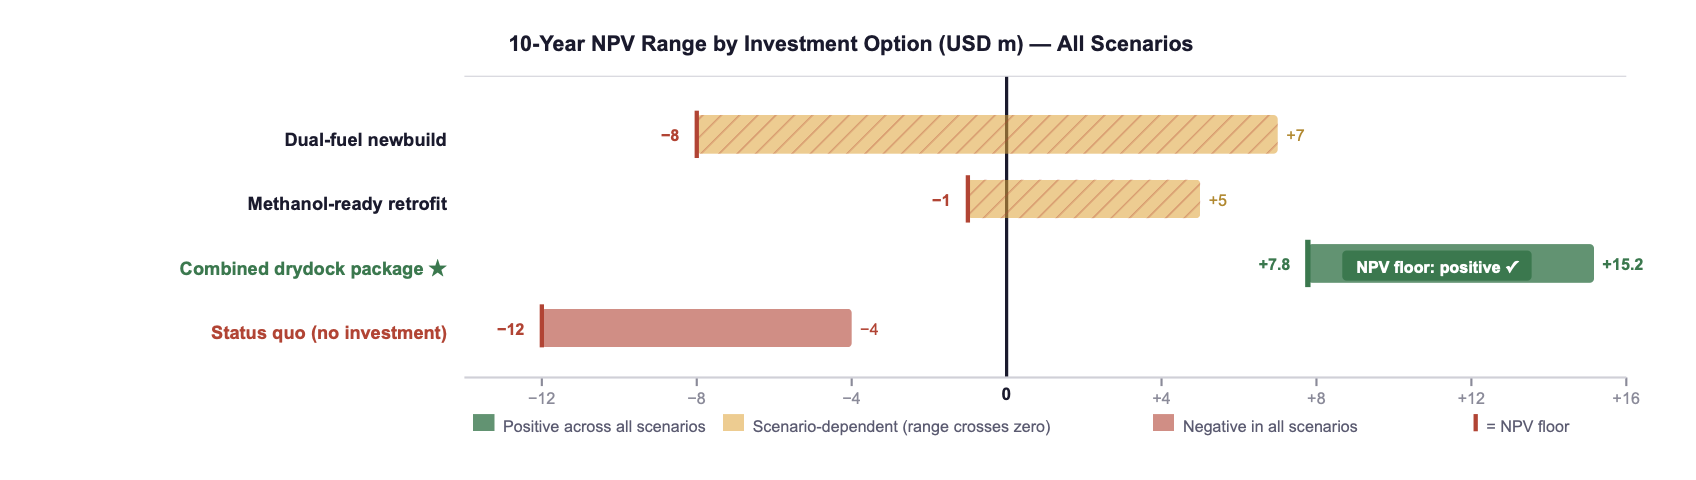
Fig. 1: NPV range bars span from adverse to optimistic scenario. Vertical marker indicates NPV floor. Combined drydock package is the only option with a positive floor across all scenarios.
Sources: ABS, 2026; Wärtsilä, 2026; own modelling.
Three observations from this framework deserve emphasis. First, the combined drydock efficiency package is the only option that delivers a positive NPV in every scenario modelled, including adverse bunker price environments. This is not a marginal advantage; it reflects the fundamental characteristic of physical efficiency improvements: they operate independently of commodity price trajectories.
Second, the status quo is not a neutral position. CII rating degradation occurs whether an owner acts or not. By 2027, CII D/E-rated vessels face exclusion from leading time-charter programmes and EU ETS cost exposure that erodes charter income directly. The cost of inaction is real and accelerating.
Third, the dual-fuel newbuild NPV range in adverse scenarios turns negative. This is not a theoretical edge case, it reflects a scenario in which LNG-to-HFO spreads compress, as they have in multiple quarters since 2022, or in which bunkering availability constrains route flexibility. For projects already under construction, this risk is locked in; for projects still in decision, the TCO framework argues for caution.
👉 Key Insight: The most financeable investment package in 2026 is the combined drydock efficiency retrofit. It delivers the lowest Capex-to-NPV ratio in the market, the shortest payback period, and the most scenario-resilient return profile. No other option offers this combination.
3. Why Banks and Charterers Now Demand TCO Thinking
The shift from Capex to TCO is not merely an analytical preference, it is becoming an institutional requirement. The Poseidon Principles, now covering over USD 185 billion in shipping loan portfolios, require signatories to align financed vessels with IMO decarbonisation trajectories. In practice, this means that a vessel's CII rating and its projected rating trajectory are now credit inputs, not just ESG footnotes.
Sea Cargo Charter has driven a parallel evolution on the commercial side. Charter parties under the SCC framework include emissions performance clauses that link freight rates to CII compliance. A vessel rated CII D or E loses commercial optionality, and loses it at exactly the moment when owners most need rate support to service debt.
The financing consequence is direct. PwC (2026) documents that efficiency retrofit projects meeting green finance criteria, typically payback under five years, third-party verified savings, and SEEMP integration, qualify for lending at 40–60 basis points below standard terms. On a USD 5 million facility over seven years, that spread difference is material. On a portfolio of ten vessels in simultaneous drydock, it is transformative.
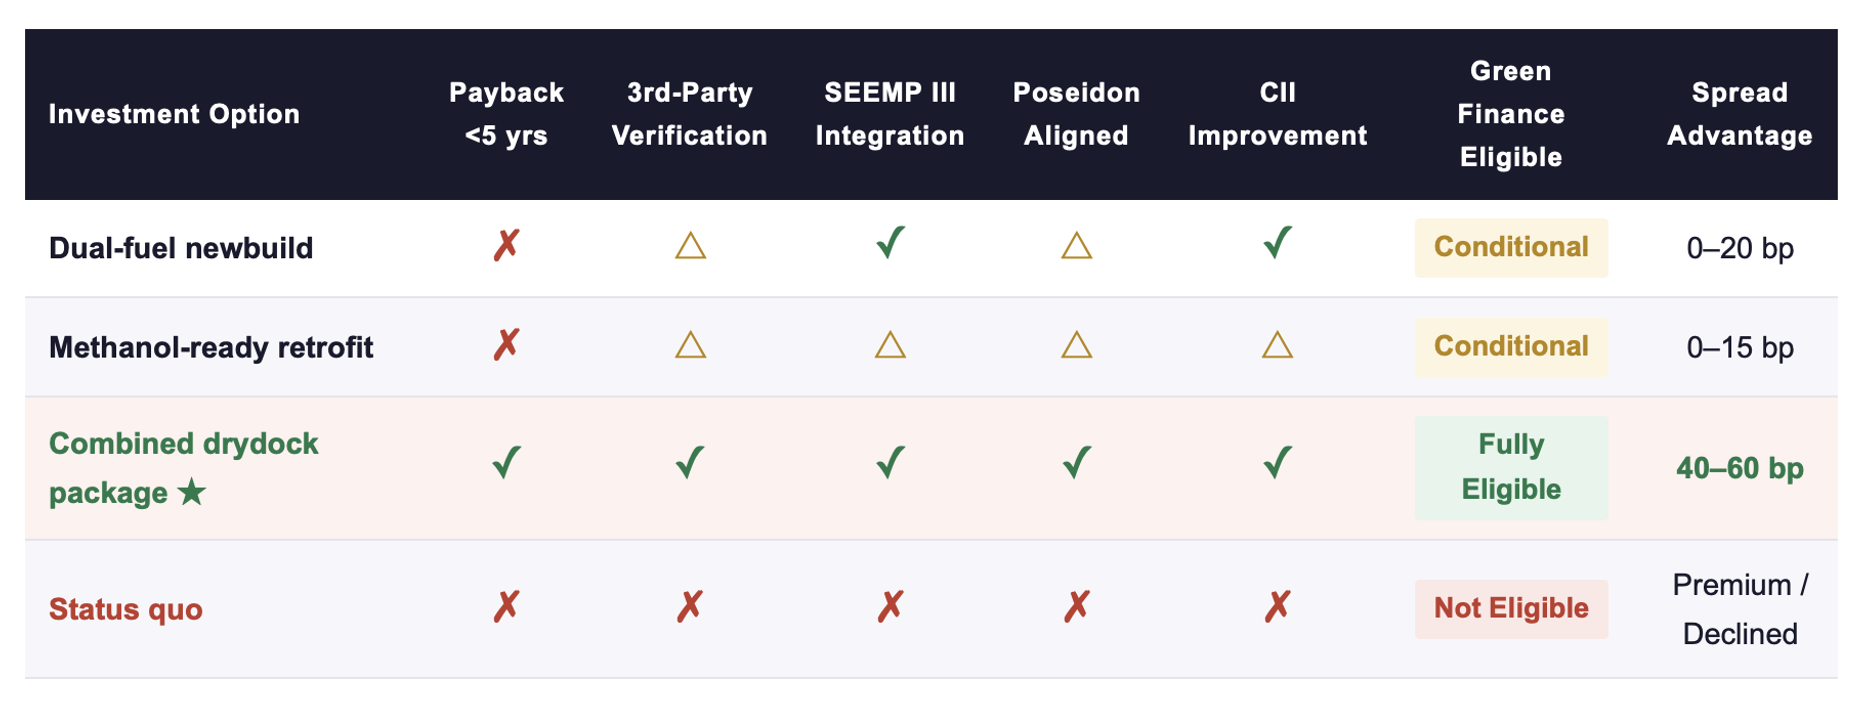
✓ = Criterion met · △ = Conditional / case-by-case · ✗ = Criterion not met. Sources: PwC, 2026; Poseidon Principles, 2024.
Projects that do not meet this profile face the inverse: premium pricing, shortened tenors, or, increasingly, outright decline from Poseidon Principles signatories who cannot demonstrate alignment under their own reporting obligations. The message from capital markets is clear and consistent: TCO is not a sophistication upgrade. It is a minimum standard.
Charterers are responding with the same logic. A growing cohort of cargo owners operating under Science Based Targets initiative (SBTi) commitments are introducing vessel-level emissions screening into their fixtures processes. The practical effect is an emerging two-tier freight market: vessels with documented efficiency profiles and positive CII trajectories attract clean charter books; vessels without them compete on price in an increasingly narrow pool.
👉 Key Insight: The commercial and financial systems have already internalised TCO thinking. Owners who continue to filter investment decisions by Capex alone will find themselves priced out of green finance, excluded from progressive charter programmes, and unable to demonstrate CII compliance to their own lenders.
4. Scenario Analysis: Why Resilience Beats Optimisation
A common objection to TCO frameworks is that they depend on assumptions, bunker prices, discount rates, operating days, that are inherently uncertain. This is correct. The response, however, is not to abandon scenario analysis; it is to use scenario analysis as the primary decision filter rather than a sensitivity footnote.
For the combined drydock efficiency package, three scenarios were modelled using ABS (2026) baseline parameters. The scenario assumptions and results are shown below.
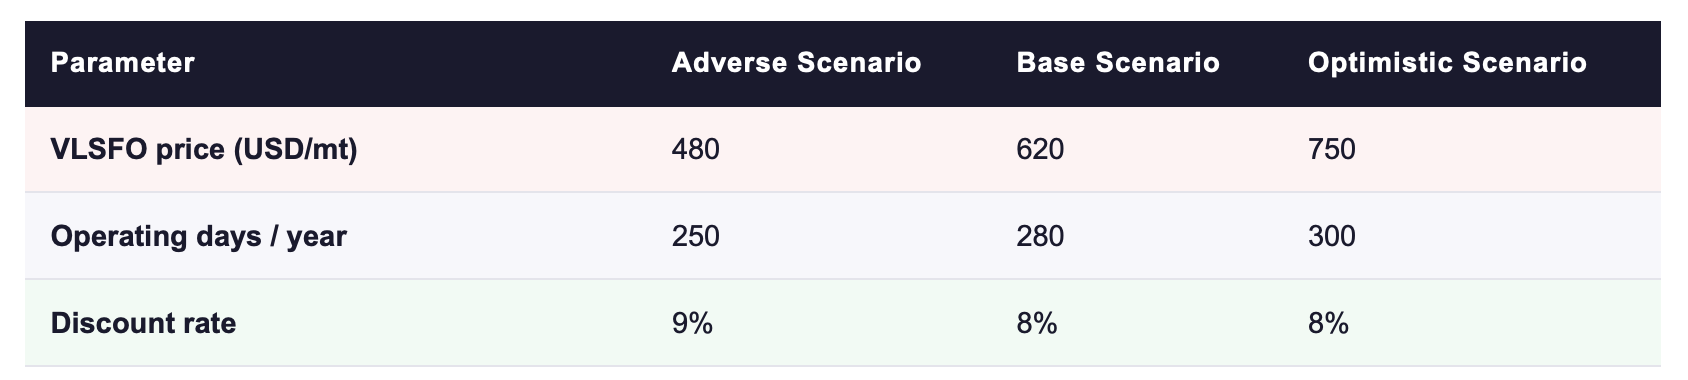
Scenario parameters based on ABS Retrofit Reports, 2026, and own modelling.
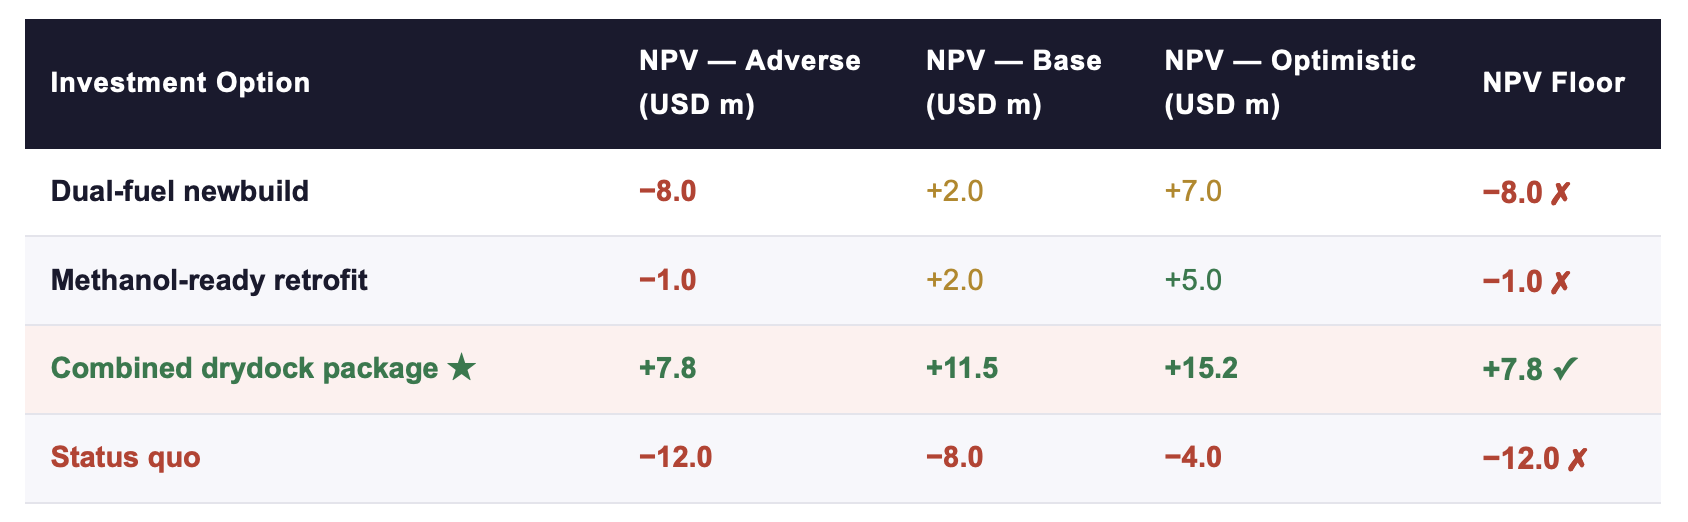
Sources: ABS Retrofit Reports, 2026; Wärtsilä, 2026; own modelling at stated discount rates. Status quo NPV represents quantified cost of CII penalties, EU ETS exposure, and foregone charter premium.
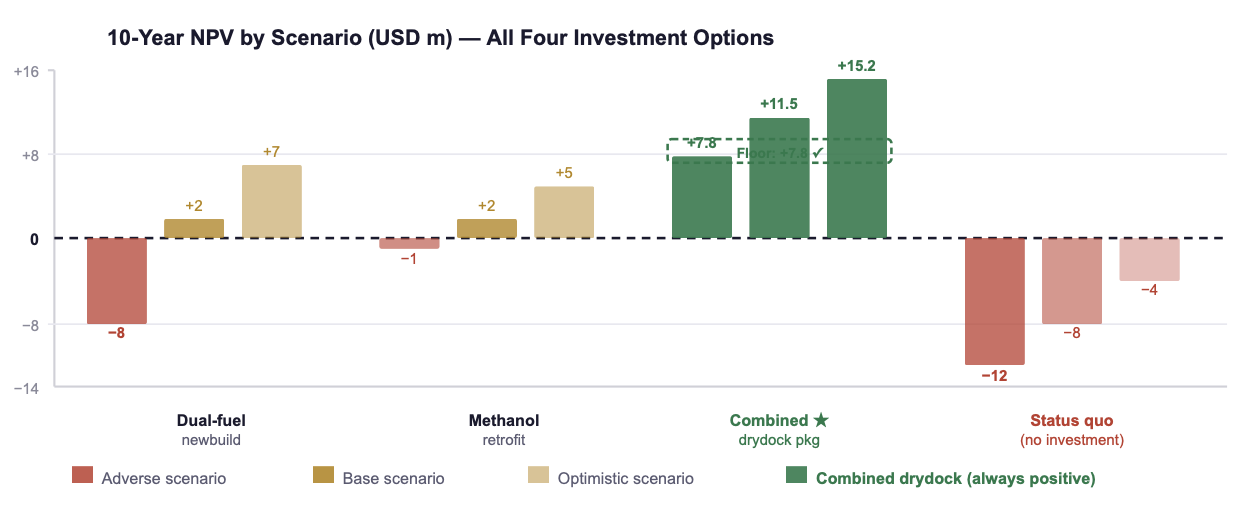
Fig. 2: Each group shows three scenario bars (adverse / base / optimistic). Only the combined drydock package remains positive in every scenario. Sources: ABS, 2026; Wärtsilä, 2026; own modelling.
The critical characteristic is the NPV floor. Unlike fuel-switching projects, where the adverse scenario NPV can turn negative (i.e., the investment destroys value under plausible conditions), efficiency retrofits maintain positive NPV across all modelled scenarios. This resilience is not accidental, it reflects the physical nature of the savings. A propeller operating at optimal pitch efficiency saves fuel regardless of whether the price of that fuel is USD 400 or USD 800 per metric tonne.
For investment committees, this framing reframes the decision. The question is not "what is our best estimate of bunker prices over the next decade?", which is unanswerable. The question is: "which investment maintains a positive return across the full range of plausible futures?" Efficiency retrofits answer that question definitively. Fuel-switching investments do not.
👉 Key Insight: The correct investment filter is not "what is the best-case NPV?" but "what is the NPV floor?" Efficiency retrofit packages maintain positive NPV floors across all modelled scenarios. That is what financeable resilience looks like, and it is what distinguishes value creation from value gambling.
5. Five Principles for Financeable Marine Investments
The following principles synthesise the TCO framework, scenario analysis methodology, and financing environment documented in this post. They are designed for use in investment committee presentations, shipowner CFO briefings, and charter negotiations.
THE FINANCEABLE INVESTMENT FRAMEWORK: 2026
Lead with TCO, not Capex. Every investment proposal must include a 10-year NPV calculation at the organisation's weighted average cost of capital. Capex is a cash flow item. NPV is the decision metric. These are not interchangeable.
Mandate scenario analysis with explicit NPV floors. Base, adverse, and optimistic scenarios should be calculated before any project reaches approval stage. The adverse scenario NPV, not the base case, is the primary decision criterion. Projects that destroy value under plausible adverse conditions should require explicit board-level risk acceptance before proceeding.
Require third-party verification of projected savings. Green finance eligibility, Poseidon Principles alignment, and charterer confidence all depend on independently verified savings projections. Self-certified estimates do not satisfy lender requirements and erode credibility in charter negotiations. Commission verification before the financing structure is finalised.
Integrate combination financing from project inception. Efficiency retrofits, CII compliance investments, and SEEMP upgrades can be structured as a single green finance facility, combining green loans, export credit, and where applicable EU-backed instruments. Financing teams that approach these as separate transactions leave spread savings and structuring flexibility on the table.
Embed SEEMP III as the management backbone. The Ship Energy Efficiency Management Plan, in its third iteration, is now a regulatory requirement under MARPOL Annex VI. More importantly, it is the document that lenders, port state control, and charterers will scrutinise for evidence of management commitment. SEEMP III should drive the investment sequencing, not follow it.
ACTION RECOMMENDATIONS
IMMEDIATE MEASURES (0–90 DAYS)
Commission a TCO audit for any vessel currently under drydock planning, recalculate all candidate projects at an 8% discount rate over 10 years before any Capex approval is issued.
Map the CII rating trajectory for your fleet through 2027 under the IMO's current methodology, identify vessels at risk of D/E ratings and quantify the charter and EU ETS cost exposure.
Request term sheets from at least two Poseidon Principles signatory lenders for your next planned efficiency project, establish what green finance spread advantage is available before finalising the financing structure.
Initiate SEEMP III documentation for any vessel not yet compliant, this is both a regulatory requirement and a financing prerequisite.
STRATEGIC COMMITMENTS (6–24 MONTHS)
Establish a fleet-wide TCO standard, mandate that no investment above USD 250,000 reaches approval without a full scenario-based NPV analysis and an explicit NPV floor calculation.
Develop a combination retrofit pipeline: bundle hull coating, propeller optimisation, pump and motor upgrades, and VFD installation into a single drydock event wherever scheduling allows, the synergy multiplier on combined packages exceeds individual project economics by 20–35%.
Engage charterers proactively on CII performance documentation, vessels that can provide independently verified CII trajectories gain commercial priority in progressive charter programmes.
Build internal TCO modelling capability, the analytical gap between owners who model correctly and those who rely on Capex intuition is widening; close it before competitors do.
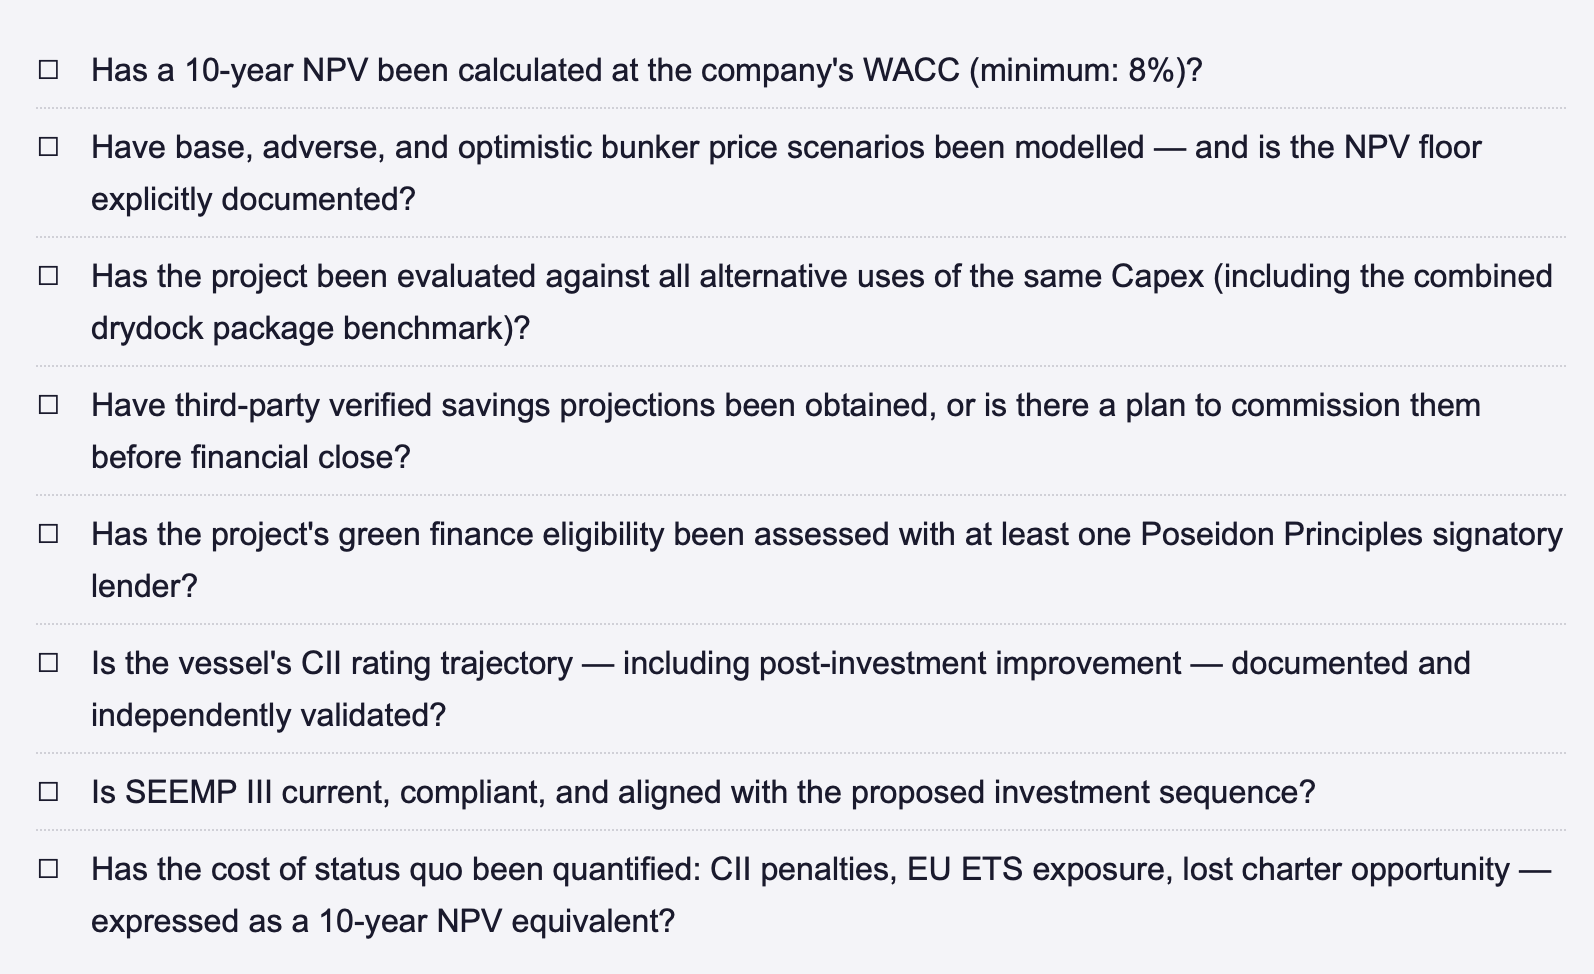
TCO DECISION CHECKLIST, BEFORE ANY MARINE INVESTMENT IS APPROVED
FINAL THOUGHT
The opening question was: why do investment committees reject a USD 500,000 pump upgrade with a 14-month payback while approving a USD 45 million dual-fuel newbuild with a 12-year payback and unresolved fuel infrastructure dependency? The answer is not irrationality, it is an information deficit. Capex is visible, comparable, and emotionally legible. TCO is none of these things, until you build the framework. The companies that build it first will not just make better individual investments. They will access cheaper capital, attract better charters, and outperform across cycles that make the projects their competitors approved look exactly like what they were: the right number, for the wrong question.
How does your organisation currently structure the handover between technical management and the investment committee, and where does TCO analysis enter the process? Share your experience or connect for a direct exchange. | Next in this series: The Drydock Synergy Multiplier, why bundling retrofits in a single yard event changes the economics of each individual measure.
REFERENCES
ABS (American Bureau of Shipping) (2026) Retrofit Efficiency Reports: Lifecycle Cost Benchmarks for Mid-Size Bulk Carriers and Tankers.Houston: ABS.
IMO (International Maritime Organization) (2023) Revised MARPOL Annex VI — CII Rating Methodology and Reduction Factors 2023–2030. London: IMO.
Nature Sustainability (2025) 'Comparative lifecycle performance of marine decarbonisation pathways: efficiency versus fuel substitution', Nature Sustainability, 8(3), pp. 214–229.
Poseidon Principles (2024) Annual Report: Portfolio Alignment and Financed Emissions 2024. New York: Poseidon Principles Secretariat.
PwC (2026) Green Finance in Shipping: Eligibility Criteria, Spread Advantages, and Lender Alignment 2026. London: PricewaterhouseCoopers.
Sea Cargo Charter (2025) Annual Transparency Report 2025: Emissions Performance and Charter Alignment. Geneva: Sea Cargo Charter Secretariat.
Wärtsilä Corporation (2026) Lifecycle Optimisation Report: Total Cost of Ownership Analysis for Propulsion and Auxiliary Systems.Helsinki: Wärtsilä.
© René Grywnow, DBA · Strategic Intelligence Brief · April 2026 Efficiency Before Fuel Series · Part 8 of 8
Note: This article reflects my personal views based on industry experience and publicly available information. It does not constitute professional, legal, or investment advice and does not represent the views of my employer.